Customer experience (CX) is all about how customers feel about your business. It starts the moment a customer hears about your brand and stretches right through to how they feel after making a purchase.
Measuring customer experience is incredibly important; by understanding your customers’ needs and preferences, you can fine-tune your services, making it more likely that they’ll return and make another purchase – maybe even spread the good word about your brand to their friends.
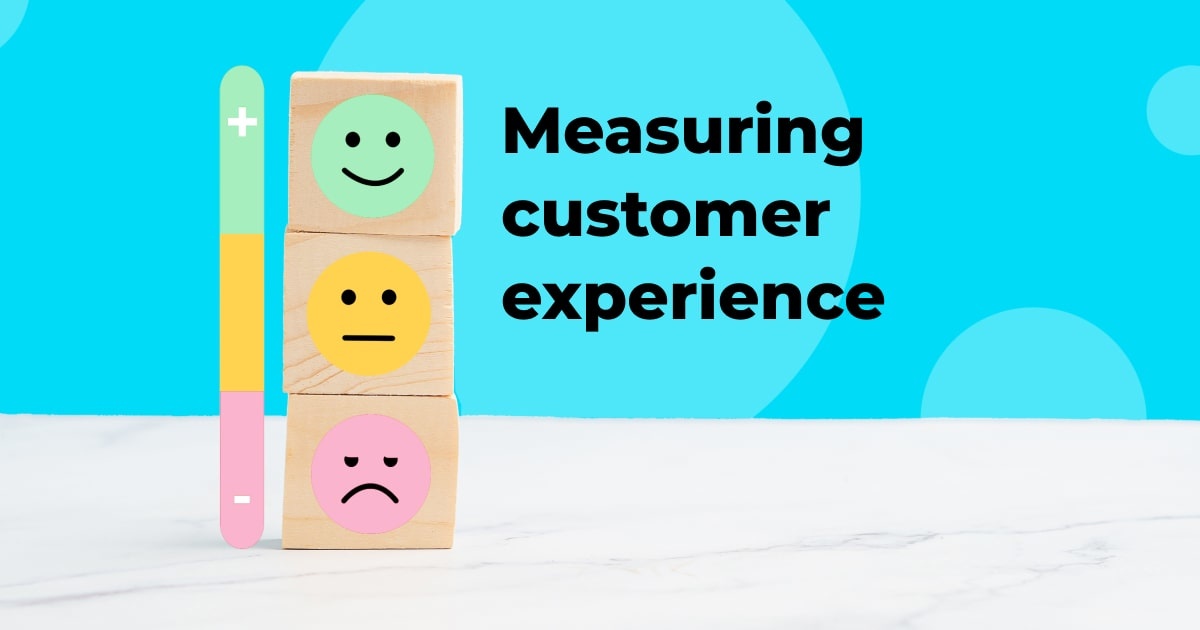
In this article, we’ll explain how to measure customer experience and show why it’s a key strategy for nurturing loyalty, boosting your reputation, and driving business success.
How is customer experience being measured?
To run a successful business, it’s essential to know how customers feel about it. Are your ads engaging? Are your products enjoyable to use? Is your support team good at solving problems?
To get answers to these questions and more, you need to know how to measure customer experience.
Customer experience metrics come from different sources – two useful ones are customer surveys and journey maps, which are common features of business management software.
Surveys are a really handy way of measuring customer experience. You can send out a survey whenever someone buys a product or talks to your customer support team. They show what you’re doing well and what you could be doing better, and can be a great way to get feedback on a new product or service.
Then there are customer journey maps. These provide a step-by-step record of all the ways a customer interacts with your business and can help you figure out why they acted in a certain way.
Say, for example, that a customer finds you through an online search. They click on your website, read some blogs, check out your products, and sign up for a free trial, but don’t end up buying a subscription. By mapping out this journey, you can see exactly where things might have gone wrong and what you can do to improve their experience next time. This way, you’re not only tracking their actions, but you’re also getting a sense of how they might have felt at each stage of the process.
Customer experience metrics
To fully understand your customers, you need to look at their experience from different angles. This calls for a good customer experience strategy and tracking the right customer experience metrics.
Here are some of the most common CX metrics businesses track as a way of measuring customer experience.
Customer effort score (CES)
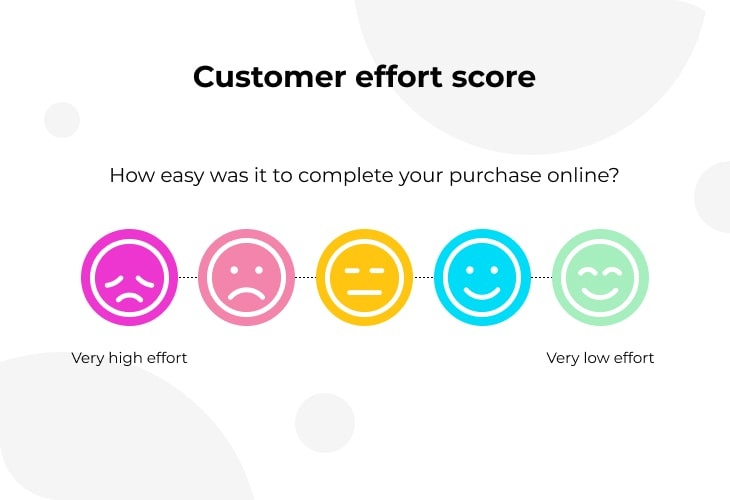
What is a customer effort score (CES)? You can think of it as a way of asking your customers, “How easy was it to do business with us?” The easier it is, the happier they’ll be with your brand.
CES is usually measured using a simple survey. After a customer interaction — like buying a product, using a service, or reaching out to your support team — you ask them to rate how easy it was on a scale of 1-10. Doing it at this stage means you get fresh and accurate feedback.
Your customer effort score calculation is a simple way to see if customers are enjoying plain sailing or putting up with a bumpy ride.
Customer satisfaction score (CSAT)
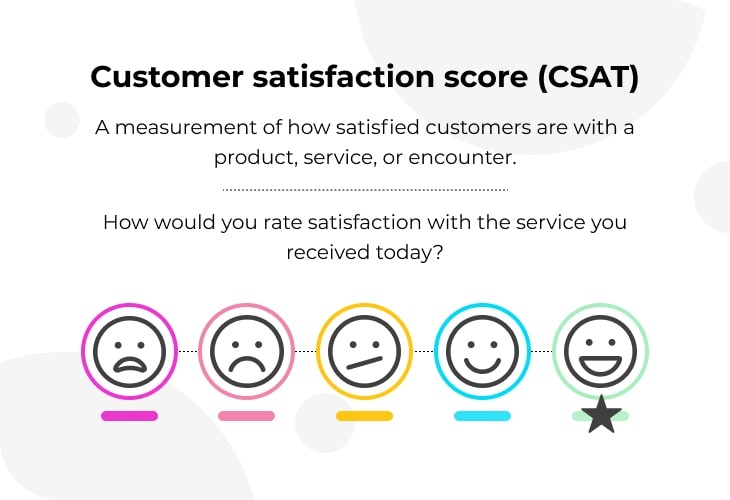
As the name suggests, customer satisfaction score (CSAT) helps measure if your customers are satisfied with your product, service, or a particular interaction. It’s like asking, “How happy are you with us?”
Just like CES, CSAT is typically measured using a simple survey. After a certain experience with your business — purchasing a product, for example — you ask customers to rate their satisfaction. The scale usually goes from 1 (very unsatisfied) to 5 (very satisfied), but the range can vary.
Your CSAT gives you a snapshot of how well you’re meeting expectations and if your customers are walking away with smiles on their faces. It’s a handy tool for spotting where you’re doing well or where you might need to improve.
Net Promoter Score (NPS)
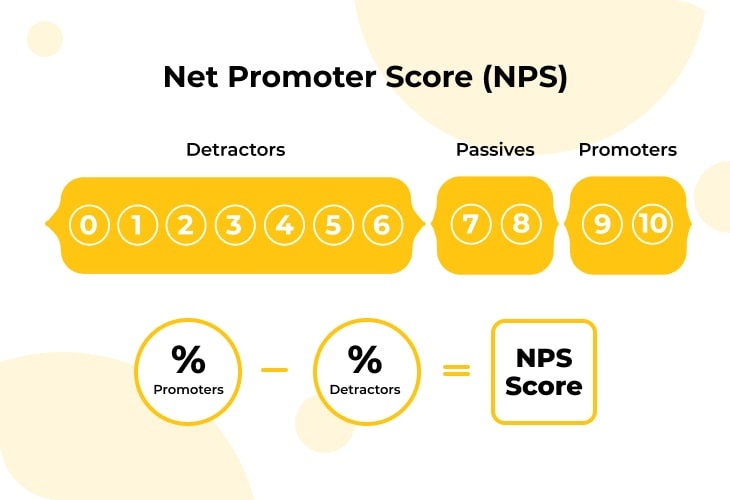
Net Promoter Score, or NPS, is all about finding out how likely customers are to praise your products or services. It can also help you with spotting difficult clients, who you might have to pay a bit more attention to – if you want to keep them.
Here’s how it works: after an interaction with your company, you ask customers to rate how likely they are to recommend your brand to friends or family on a scale of 0 to 10. Anyone who awards a score of 9 or 10 is considered a ‘promoter’ who might sing your praises. People who score 7 or 8 are ‘passives’, while anyone who scores 0 to 6 might be less than thrilled.
Your Net Promoter Score calculation works by subtracting the percentage of your less-thrilled customers from the promoters. This score can tell you a lot about customer loyalty – if people are willing to recommend your business to others, that’s a pretty big compliment. Your NPS can help you find out if you’re building strong relationships with your customers, or if you might need to work on making things right.
Customer retention rate
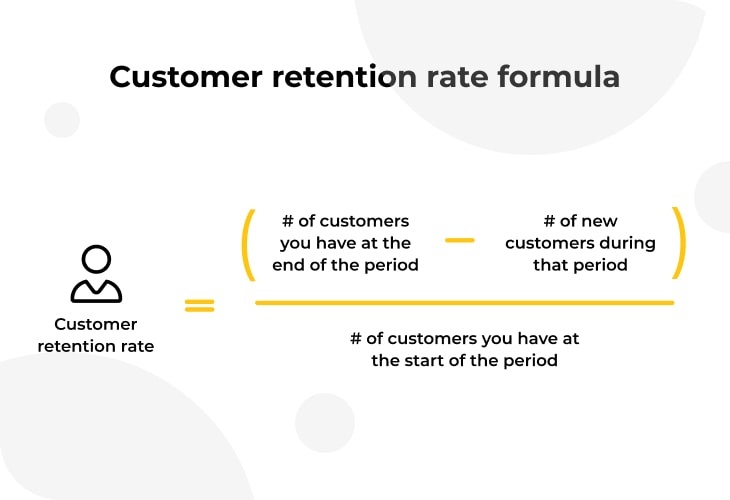
This customer experience measurement gauges how likely your customers are to hang around and keep buying your products or services.
Here’s how to calculate customer retention rate: First, look at how many customers you had at the start of a period (e.g. a year). Then see how many of those same customers are still with you at the end of that period. If you started with 100 customers and still have 99 of them at year’s end, your customer retention rate is 99%.
It’s worth paying attention to this number because It’s usually easier and cheaper to retain a customer than to find a new one. Plus, customers who stay with you are more likely to spend money and spread the good word about your brand.
What is a good customer retention rate? Well, that can vary based on the nature of your business. While it’s useful to compare your score against industry benchmarks, what’s most important is that you’re improving your rate over time. Generally speaking, a customer retention rate above 70% is good.
Customer churn rate
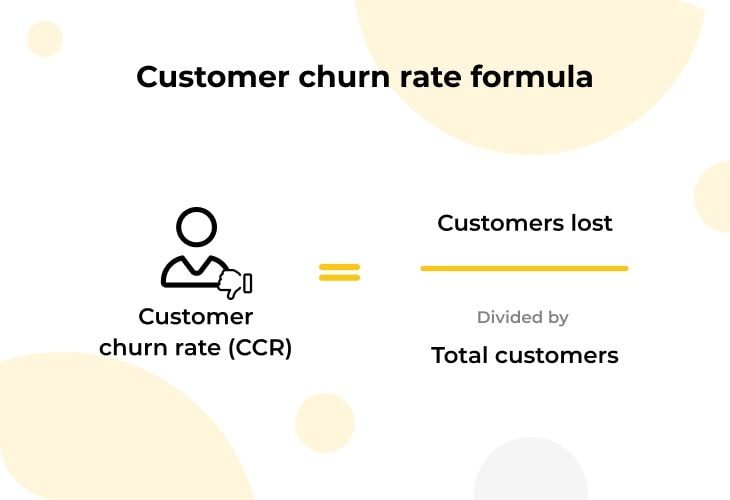
What is the customer churn rate? Well, it’s basically the opposite of your customer retention rate. It shows how many customers are saying ‘goodbye’ to your business over a certain period.
The customer churn rate formula is simple; let’s say that you start a year with 100 customers but by the end, 20 of them have stopped doing business with you. Those 20 are your ‘churned’ customers, and your customer churn rate is 20%.
It’s worth paying close attention to this customer experience measurement because a high churn rate could signal that your product or service isn’t hitting the mark, or perhaps your customer service needs more work.
First contact resolution (FCR)
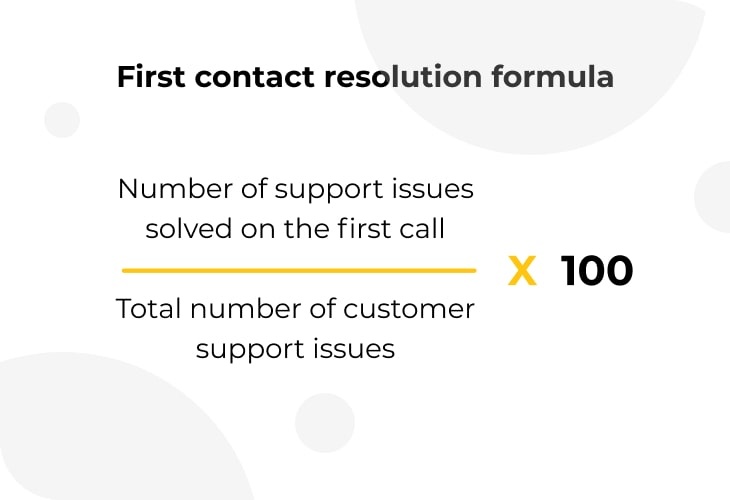
Your first contact resolution rate measures how many customer issues are resolved by your support team the first time you ask. Say a customer rings up your helpdesk with a problem. If your team can fix it right then and there without having to follow up or transfer the call, that’s a win for FCR.
The reason this metric is important is that customers love efficiency. They don’t want to spend ages on hold or have to call back multiple times to sort out an issue. The faster and smoother you can solve their problems, the happier they’ll be.
The first contact resolution calculation involves counting up the number of issues that were resolved on the first contact over a certain period. You then divide that by the total number of issues resolved in the same period. Finally, multiply that by 100 to get a percentage — and that’s your FCR rate.
Remember, your aim is to achieve a high FCR rate — it means you’re resolving more issues quickly and efficiently, which is something your customers will love. If your FCR rate is lower, it’s a sign that your level of customer service needs improvement.
Average resolution time
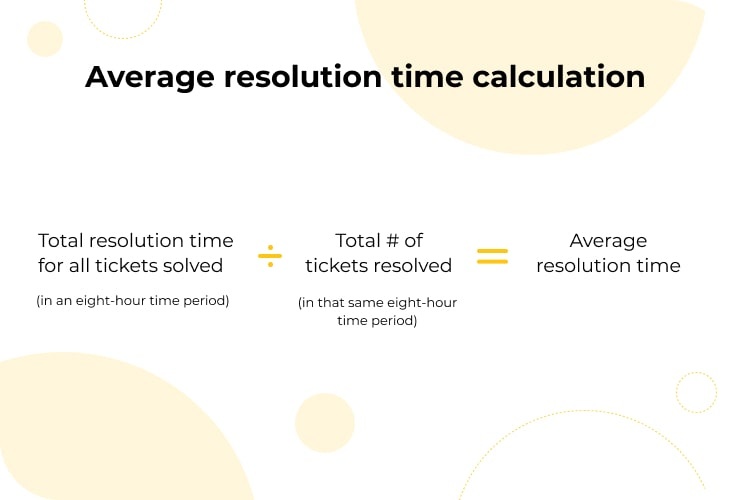
This is the average amount of time it takes for a customer issue or query to be resolved. The clock starts ticking from the moment a customer contacts your business with a problem and stops when the issue is fully resolved.
To calculate it, you use the ‘average resolution time formula‘: add up the total time spent resolving issues and divide by the number of issues resolved.
So, if you resolved 10 issues in a week and it took a total of 500 minutes, you’d divide 500 by 10. This gives you an average resolution time of 50 minutes per issue. Knowing how to calculate average resolution time is key for any customer-oriented business. Keeping this number low means you’re tackling issues quickly, boosting customer satisfaction. If you use client portal software, then high chances are you can look this value up in your client records.
Monthly active users (MAU)
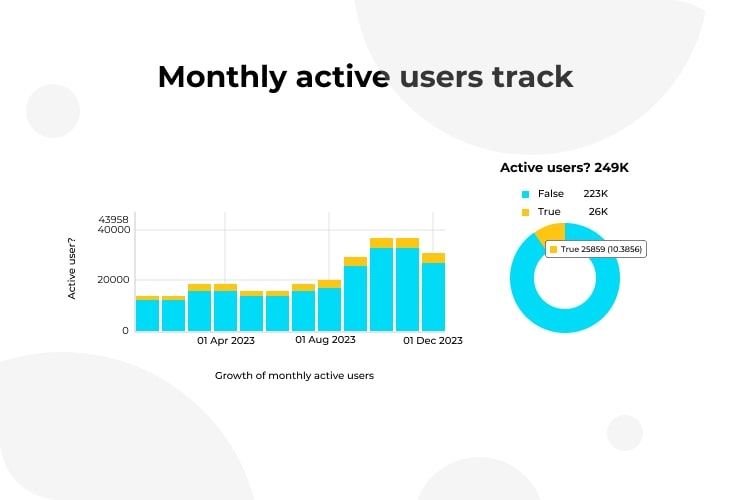
This metric is useful for measuring the customer experience in online environments as it tells you how many unique users engage with your website, app, or platform over the course of a month. Engagement can mean different things depending on your platform — maybe they’ve logged in, made a purchase, or even just clicked on a link.
For a social media platform, for example, an active user might be someone who logs in and posts, comments, or likes content. For an online shop, an active user could be someone who makes a purchase, adds items to a cart, or browses products. For a mobile app, it might be someone who opens the app and interacts with its features.
Once you’ve defined what ‘active’ means for your specific business context, you can start tracking MAU as a key indicator of your platform’s engagement and growth.
Trial-to-paid conversion rate
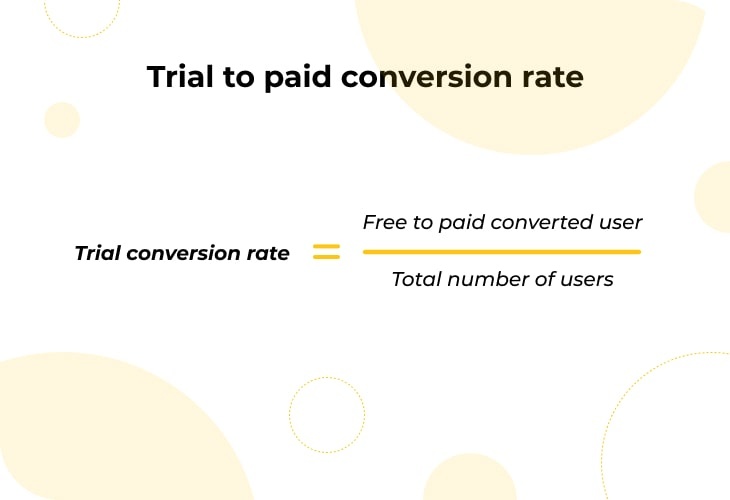
This metric shows the percentage of users who agree to sign up for a paid version of your product after taking part in a free trial.
To calculate your trial-to-paid conversion rate as a percentage, first, divide your total number of users who become paying customers by the total number of users who started the free trial, then multiply that number by 100.
For instance, if 200 users start a free trial in a month, and 40 of them become paying customers, your trial-to-paid conversion rate would be (40 / 200) x 100 = 20%.
This metric can help you understand how effective your free trial is in encouraging users to commit to a paid plan. If your conversion rate is low, it might show that users aren’t seeing enough value in your paid features, so you might want to think twice about your product or pricing.
Measuring customer experience
To build a successful business, it’s essential to focus on measuring the customer experience. Whether it’s in an online environment or a traditional setting, evaluating key customer experience metrics can reveal areas needing improvement.
Using tools like client management software can help provide additional insights into customer preferences and behaviors. Remember, keeping track of your customers’ journeys and refining your services accordingly can elevate your business to new heights, so it’s well worth embracing the science of customer experience measurement.